Seasonal adjustment of the Index of Industrial Production (IIP)
What is the index of industrial production and why is the data seasonally adjusted?
UNIDO Statistics Division collects and publishes data on index numbers of industrial production (IIP) since years to provide reliable growth estimates of world manufacturing production. So far, seasonally adjusted quarterly data (QIIP) was published in the respective database available on the UNIDO statistics portal. Furthermore, the main results of this data collection were regularly presented in Quarterly Reports on World Manufacturing Production in addition to annual IIP data in the International Yearbook of Industrial Statistics and the INDSTAT 2 database.
In the context of the global outbreak of COVID-19 in the beginning of 2020, UNIDO Statistics Division intensified its efforts to make reliable information from national statistical offices (NSO’s) rapidly available. Besides quarterly data, UNIDO started publishing monthly index data on industrial production (MIIP) as well.
What is the index of industrial Production?
IIP measures the growth of the volume of industrial production in real terms, free from price fluctuations. Users should take note that while annual industrial growth rates generally refer to changes in value added, i.e. output net of intermediate consumption, the quarterly and monthly indices reflect the growth of gross output. Given the temporal nature of estimates, output growth provides the best approximation of value added growth, assuming that the input-output relationship is relatively stable during the observation period.
The main data source of the annual, monthly and quarterly IIP published by UNIDO represents index numbers disseminated by National Statistical Offices (NSO's). NSO’s mainly publish original (unadjusted) and/or seasonally adjusted data series which is both collected by UNIDO Statistics division. In case that only unadjusted data is available for a country, UNIDO carries out a seasonal adjustment procedure for sub-annual data as explained below.
IIP is usually published with a specific base period. Such an index reference period is the period against which other periods are compared and for which the index is set equal to 100. Starting with the reporting year 2020, the selected base period in UNIDO publication is the year 2015. If NSO’s provide data with another base period, UNIDO rebases this data to fit the chosen base year.
Why are the sub-annual index of industrial production (MIIP, QIIP) seasonally adjusted?
The purpose of seasonal adjustment in sub-annual data is to filter seasonal fluctuations or calendar effects within the time series which occasionally make it difficult or impossible to detect economic features in time series. In this way, the seasonally adjusted results do not show "normal" and repeating events, rather seasonally adjusted data help to reveal the "news" contained in the time series, (IRIIP, p. 102).
One way to describe a time series is by its components:
- Seasonal effects: cyclical fluctuations related to the calendar (including moving holidays, working day effects, periodic fluctuations, such as Christmas effect, etc.)
- Cycles: cyclical fluctuations longer than a year (such as business cycles)
- Trend: long-term movements at the level of the series
- Irregular: other random or short-term unpredictable fluctuations (such as strikes or unusual weather situations)
In general, seasonally adjusted time series only contain irregular and trend components.

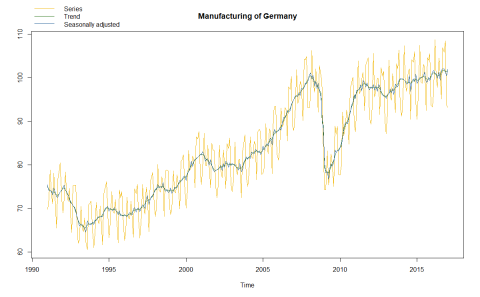
Figure 1 shows a JDemetra+ output of Manufacturing Production of Germany including original as well as seasonally adjusted data and the trend.
One common misconception of seasonal adjustment is that it hides present outliers. Outliers are extreme observations that deviate from the trend. These abnormal values may occur as a result of new policies or new types of taxes, extreme natural events or a closure of a significant manufacturer.

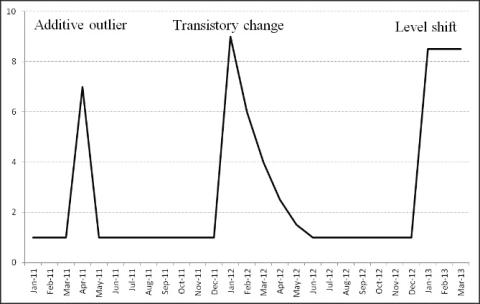
Figure 2 shows different types of outliers which are described below.
- Additive outliers (AO): This outlier type affects a single observation caused by a random or short-term effect, such as a strike. After this interruption, the series returns to its normal path as if nothing happened.
- Transitory change (TC): These outliers are spikes that take several periods to disappear exponentially. TC may occur due to deviations from average monthly weather conditions.
- Level shift (LS): It refers to a more permanent change which may also occur as a result of changes in economic behavior or in legislation. Level shifts change the level of the time series, but do not modify seasonal behavior.
One needs to consider that level shifts are assimilated by the trend component, whereas additive outliers and transiet changes are attributed to the irregular component.
How does UNIDO apply seasonal adjustment?
Since 2017, UNIDO achieves seasonal adjustment using TRAMO/SEATS method as implemented in JDEMETRA+ software at country level. This adjustment is performed only if the original data reported by the national sources exhibit clear presence of seasonality. UNIDO may occasionally conduct seasonal adjustment also in other cases, such as nowcasting.
TRAMO/SEATS is a model-based approach and provides a powerful method for forecasting and signal extraction in univariate time series. Identifying the above-mentioned outlier types is crucial because TRAMO/SEATS is based on moving average and is therefore sensitive to extreme values.
UNIDO applies the TRAMO/SEATS method to produce seasonally adjusted IIP data using JDemetra+, mainly due to the following reasons:
- Understandable statistical tests can be used
- Accurate automatic outlier detection and correction as well as automatic model identification
- Low probability of finding spurious seasonality
- Simple and easy to use interface
Besides the automatic procedures implemented in JDemetra+, model modification by the user is often necessary where in-time modeling of unpredictable and unstable events is done with a focus on a stable time series. Massive economic uncertainties or other unusual events need to be analyzed carefully and included in the seasonally adjusted time series as outliers. In case of the economic crisis of 2020 caused by COVID-19, most likely level shifts or transitory changes need to be applied instead of additive outliers, as an immediate recovery in the subsequent months is not realistic according to economists’ prevalent opinions.
Anyway, data revisions need to be carried out as soon as new data or information are accessible. In UNIDO Statistics, the new specification is defined when all the sub-annual IIP data become available. These models are revised based on a semi-concurrent revision for each reporting period when new data are included. Besides all the advantages of seasonally adjusted data for a better understanding of “news” in the time series, users should carefully consider the implications of seasonal adjustment for their analysis (e.g. using specific econometric models).
References
[1] UNIDO (2020), World Manufacturing Production (Methodological Note), pdf.
[2] UNIDO (2020), Seasonal adjustment of IIP (Methodological note), pdf.
[3] UNSD/DESA (2010), International Recommendations for the Index of Industrial Production (IRIIP), pdf.
[4] Sylwia Grudkowska (2015), JDemetra+ User Guide, Naradowny Bank Polski, pdf
[5] Sylwia Grudkowska (2016), JDemetra+ Reference Manual, Naradowny Bank Polski, pdf.
